
Meeting roughly a quarter of global energy demand growth, renewables saw the highest growth rate of any energy source in 2017, according to the International Energy Agency’s (IEA) first “Global Energy and CO2 Status Report.” In addition, while the world experienced an increase in carbon emissions last year, the U.S. did not follow suit.
According to IEA, global energy demand – boosted by strong global economic growth – rose by 2.1% in 2017, representing more than twice the previous year’s rate.
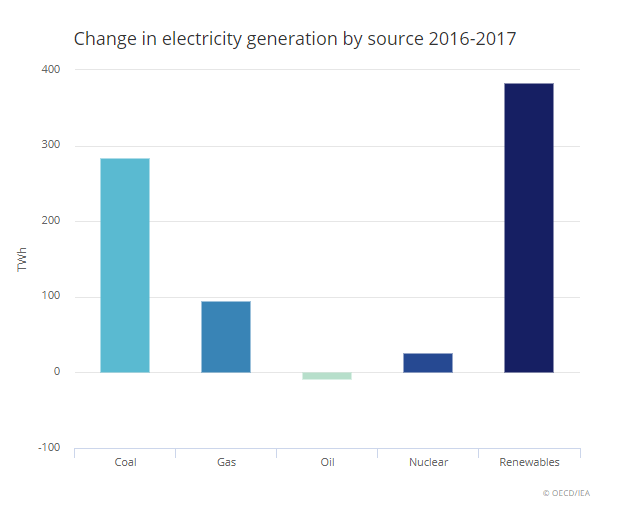
While more than 70% of global energy demand growth was met by oil, natural gas and coal, renewables accounted for nearly all the rest, says IEA.
According to the report, the power sector played the most important role in the growth of low-carbon energy, with renewables-based electricity generation increasing by 6.3% (380 TWh) in 2017. China and the U.S. together accounted for half of the increase in renewables-based electricity generation, followed by the European Union (8%), Japan and India (with 6% of growth each).
Notably, IEA calls the growth of wind power and solar PV in 2017 “unprecedented”; at 36%, wind power accounted for the largest share of overall renewables growth, followed by solar PV (27%), hydropower (22%) and bioenergy (12%).
The report says China accounted for 40% of the combined growth in wind and solar PV, with new record capacity additions and a reduction in the rate of curtailment. Nearly 40% of the increase in hydropower was in the U.S., while the European Union reduced hydro output by nearly one-tenth. The European Union, China and Japan accounted for 82% of global bioenergy growth in power.
However, according to IEA, China overtook the U.S. to become the world leader for non-hydro renewables-based electricity generation. It was a particularly extraordinary year for solar PV additions in China, with over 50 GW of new capacity – exceeding the combined capacity additions of coal, gas and nuclear. The new solar PV capacity added in China in 2017 alone is equivalent to the total solar PV capacity of France and Germany combined, the report says.
In the U.S., 10 GW of solar PV was added in 2017, which is down 30% relative to 2016 but still represents the second-highest year on record. In India, a record 8 GW of solar PV capacity was added in 2017, representing double the additions seen in 2016. In the European Union, wind saw a record year with 15.6 GW of capacity additions, of which 3.1 GW was offshore, also a record. With continued growth in onshore wind power, global wind capacity (onshore and offshore) reached about 510 GW, the report says.
However, energy efficiency improvements slowed significantly, with global energy intensity improving by only 1.7% in 2017 compared with 2.3%, on average, over the last three years. IEA attributes this to an apparent slowdown in efficiency policy coverage and stringency and lower energy prices.
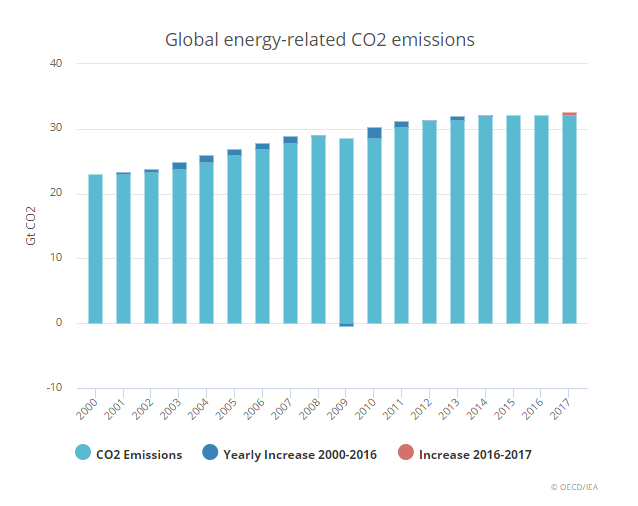
Notably, the report says, global energy-related carbon dioxide (CO2) emissions increased by 1.4% in 2017, following three years of remaining flat.
However, CO2 emissions, which reached a historic high of 32.5 gigatons in 2017, did not rise everywhere. While most major economies saw a rise, others – the U.S., the U.K., Mexico and Japan – experienced declines. The biggest drop in emissions came from the U.S., driven by higher renewables deployment, says IEA.
“The robust global economy pushed up energy demand last year, which was mostly met by fossil fuels, while renewables made impressive strides,” states Dr. Fatih Birol, IEA’s executive director. “The significant growth in global energy-related carbon dioxide emissions in 2017 tells us that current efforts to combat climate change are far from sufficient. For example, there has been a dramatic slowdown in the rate of improvement in global energy efficiency as policymakers have put less focus in this area.”
According to the report, oil demand grew by 1.6%, more than twice the average annual rate seen over the past decade, driven by the transport sector (in particular, a growing share of SUVs and trucks in major economies), as well as rising petrochemical demand.
Natural gas consumption grew 3% – the most of all fossil fuels – with China alone accounting for nearly a third of this growth and the buildings and industry sectors contributing to 80% of the increase in global demand. On the other hand, coal demand rose about 1%, reversing declines over the previous two years, driven by an increase in coal-fired electricity generation mostly in Asia, says IEA.
Overall, according to the report, electricity generation increased by 3.1%, significantly faster than overall energy demand, and India and China together accounted for 70% of the global increase. Fossil fuels accounted for 81% of total energy demand in 2017 – a level that has remained stable for more than three decades.
More on the report can be found here.


